Turn data into meaningful visualisations. Get reports and insights faster than ever.
Data visualisation is the graphical representation of information and data. By using visual elements like charts, graphs, and maps, businesses can provide an accessible way to see and understand trends, outliers and patterns from structured or unstructured data.
In the world of big data, data visualisation technology and tools are essential to analyse massive amounts of information and make data-driven decisions.
Whether you’re looking for actions from a specific IP address, analysing a spike in transaction requests, or hunting for a taco spot in a one-mile radius, all of the problems we’re trying to solve boil down the data analytics and visualisation.
Classic Data Visualisation
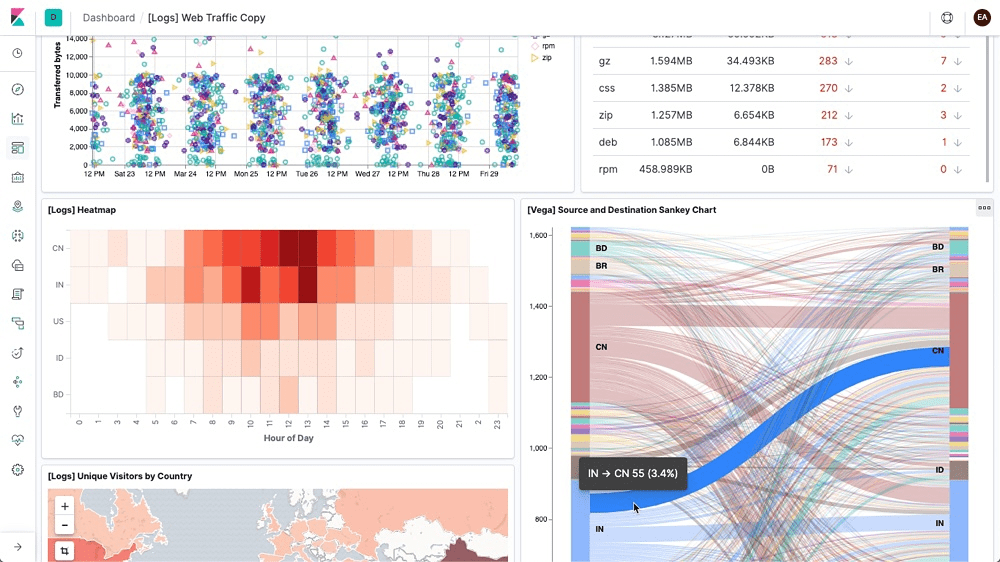
The foundation of visualisations starts with the basics like histograms, line graphs, sunbursts and more.
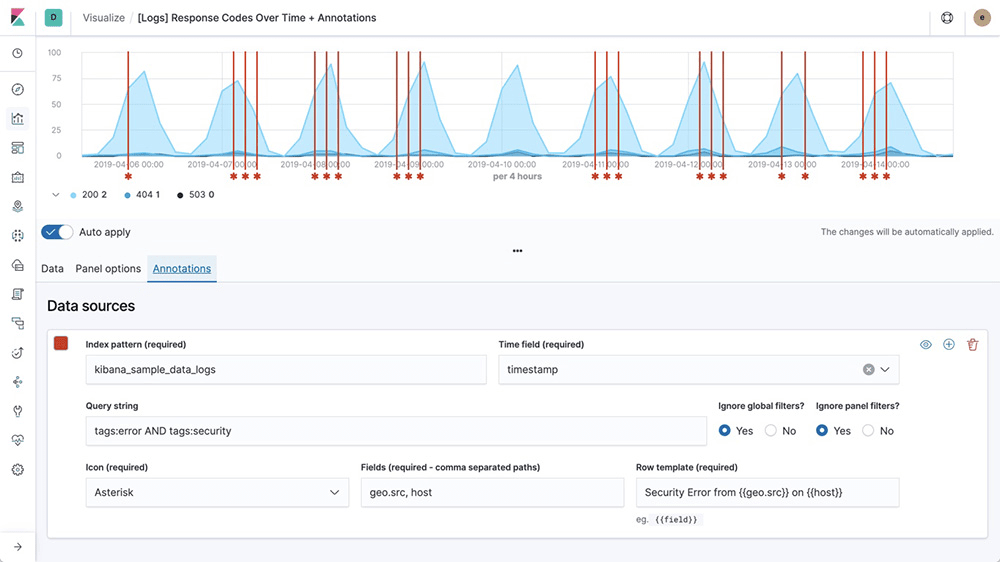
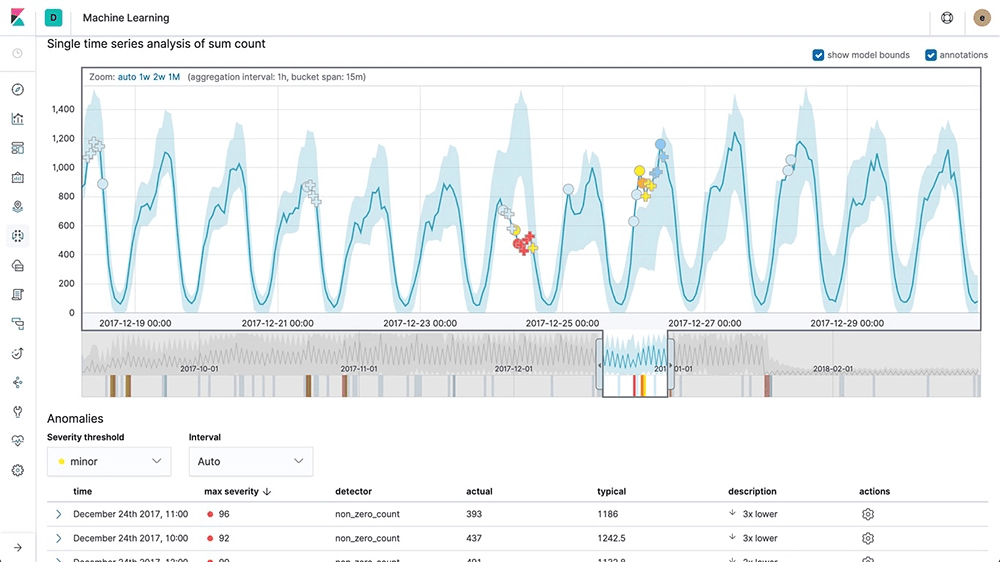
Time Series
Perform advanced time series analysis on your data. Describe queries, transformations, and visualisations.
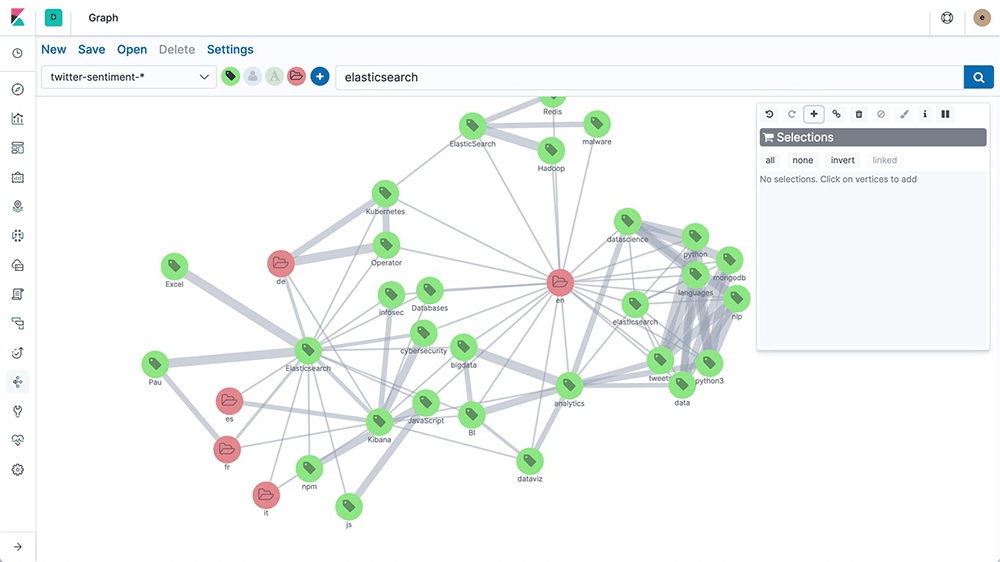
Graphs and Networks
Take the relevance capabilities of a search engine, combine them with graph exploration and uncover the uncommonly common relationships in your data.
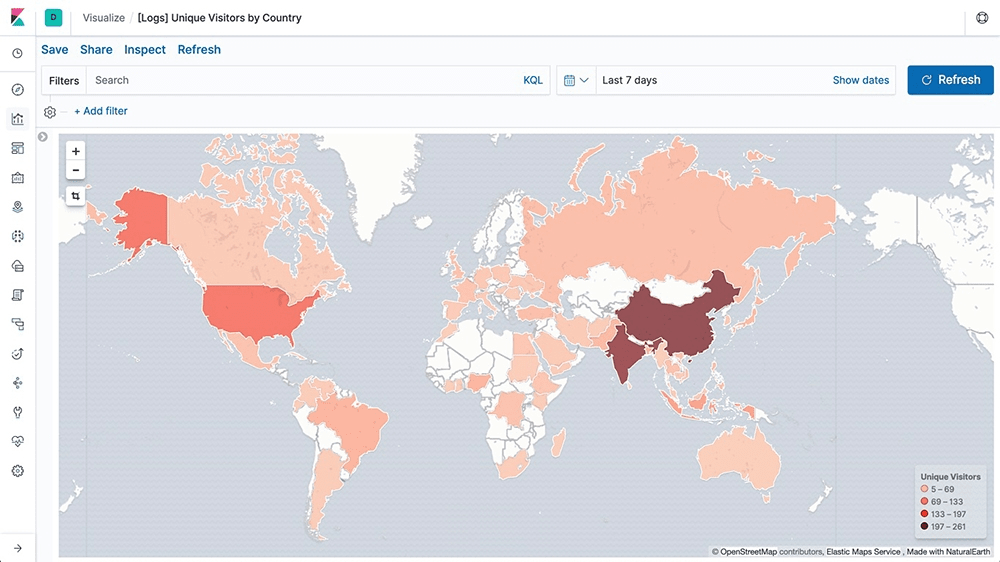
Location Analysis
Leverage maps to explore location data globally or locally down to the streets, suburbs, cities and mountains of New Zealand.
The future of data visualisation with ai
One of the major trends in leading technology platforms is the integration of ai and smart technologies. Increasingly machine learning will play a role in visualisation to detect anomalies hiding in your data and explore the properties that significantly influence them with unsupervised machine learning features.
The advantages of good data visualisation
A picture is worth a thousand log lines. Data visualisation gives you the freedom to select the way you shape your data. From the basics like line graphs, pie charts and sunbursts through to location analysis, time series or relational networks, data visualisation enables your business to present business analytics in a meaningful way.
When we see a chart we quickly see trends and outliers. If we can see something, we internalise it quickly. It’s storytelling with a purpose. If you’ve ever stared at a massive spreadsheet of data but couldn’t see a trend, you know how much more effective visualisation can be.
Big Data is here and we need to know what it says
As the rapid explosion of automation technology and ai advance data visualisation is an increasingly key tool to make sense of the trillions of rows of data generated every day. Data visualisation helps to tell stories by curating data into a form easier to understand.